PCA ומרחב הצורות
שבוע 6 — ניתוח רכיבים עיקריים
שי גורדין | אוניברסיטת אריאל
PCA — למה?
אחרי GPA: לכל פרט יש 16 מספרים (8 נקודות × x,y).
אי אפשר להציג 16 ממדים בבת אחת.
PCA (ניתוח רכיבים עיקריים) מוצא את כיווני השונות הגדולים ביותר ומאפשר הצגה דו-ממדית.
רכיב עיקרי (PC) — מה זה?
- PC1 — הכיוון שמסביר הכי הרבה שונות
- PC2 — הכיוון הניצב ל-PC1 שמסביר הכי הרבה מהשונות הנותרת
- וכן הלאה…
הערה
כל PC הוא שינוי צורה — תנועה לאורך הציר מראה כיצד הצורה משתנה בין קצות הסקאלה.
PCA ב-Python — מטבעות
from sklearn.decomposition import PCA
import numpy as np
import matplotlib.pyplot as plt
from bidi.algorithm import get_display
rtl = get_display

# aligned.shape = (20, 8, 2) → שטחו ל-(20, 16)
X = aligned.reshape(len(aligned), -1)

# PCA
pca = PCA()
scores = pca.fit_transform(X)

# אחוזי שונות
var_explained = pca.explained_variance_ratio_ * 100
print(f"PC1: {var_explained[0]:.1f}%")
print(f"PC2: {var_explained[1]:.1f}%")
print(f"יחד: {var_explained[:2].sum():.1f}%")
גרף פיזור (Scatter Plot) — מרחב הצורות
fig, ax = plt.subplots(figsize=(8, 7))

# צביעה לפי קיסר (Hadrian vs Antoninus)
colors = ['#e07b39' if i < 10 else '#4a90c4'
          for i in range(20)]
labels = ['הדריאנוס'] * 10 + ['אנטונינוס פיוס'] * 10

scatter = ax.scatter(scores[:, 0], scores[:, 1],
                     c=colors, s=80, alpha=0.8,
                     edgecolors='white', lw=0.5)

ax.set_xlabel(rtl(f"PC1 ({var_explained[0]:.1f}% שונות)"))
ax.set_ylabel(rtl(f"PC2 ({var_explained[1]:.1f}% שונות)"))
ax.set_title(rtl("מרחב הצורות — מטבעות רומיים"))
ax.axhline(0, color='grey', lw=0.5, ls='--')
ax.axvline(0, color='grey', lw=0.5, ls='--')

from matplotlib.patches import Patch
legend = [Patch(fc='#e07b39', label=rtl('הדריאנוס')),
          Patch(fc='#4a90c4', label=rtl('אנטונינוס פיוס'))]
ax.legend(handles=legend)
plt.tight_layout()
plt.show()
מרחב הצורות — תוצאות אמיתיות
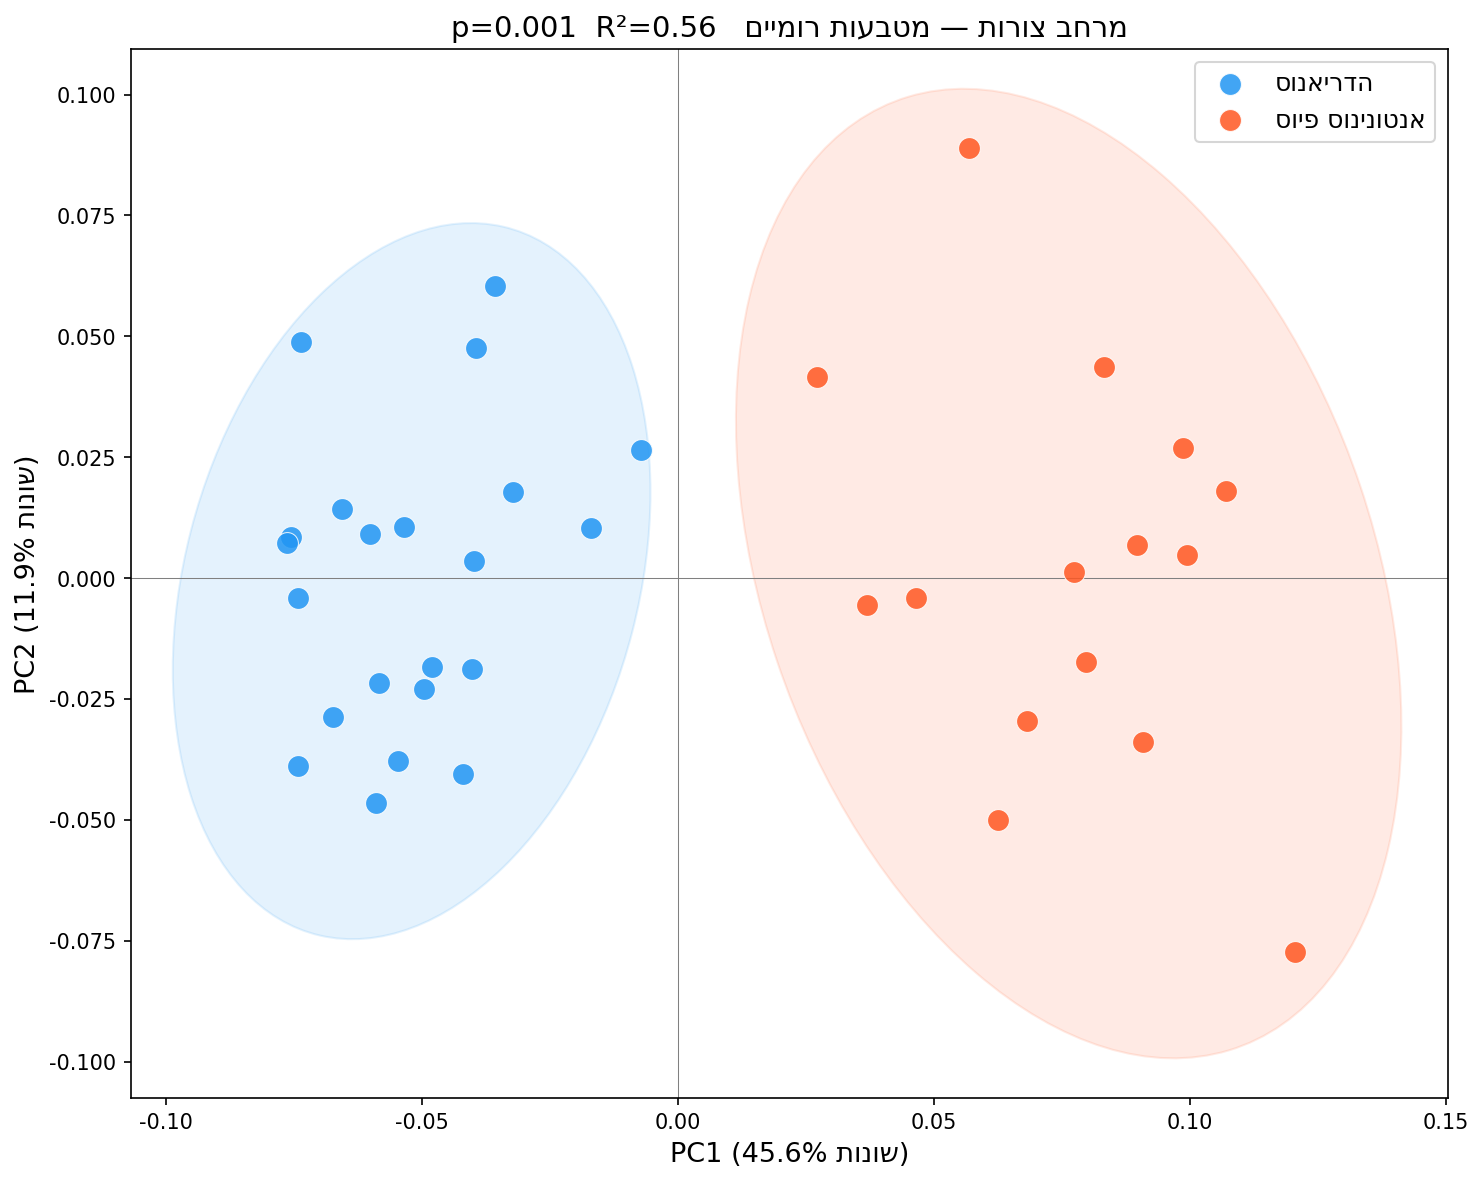
PCA מטבעות רומיים — הדריאנוס ואנטונינוס פיוס
שתי הקבוצות נפרדות בבירור לאורך PC1 — ההבדל בצורת הדיוקן.
גרף שדרה (Scree Plot)
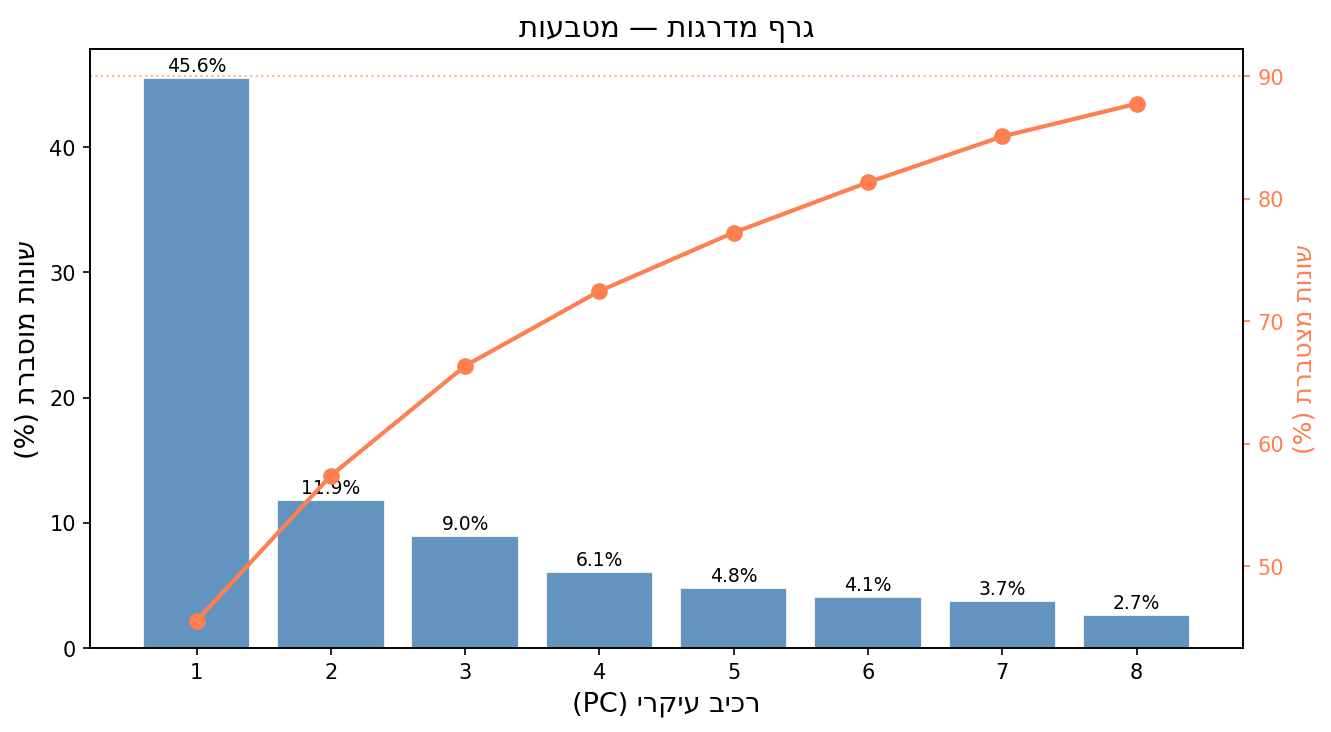
אחוזי שונות לפי רכיב עיקרי
PC1 לבדו מסביר את רוב השונות — המחלוקת בין הקיסרים ברורה.
קריאת גרף מרחב הצורות
- נקודות קרובות = צורות דומות
- נקודות רחוקות = צורות שונות
- כיוון PC1 = ציר השונות הגדול ביותר
- ריכוז קבוצה = אחידות יצור / בחירה
עצה
בדקו: האם הדריאנוס ואנטונינוס מופרדים? מה זה מסביר על יצור המטבעות?
גרידי הצורה (Deformation Grids)
from morphops import tps_warp
import numpy as np

def plot_deformation(mean_shape, target_shape, ax, title):
    """מציג עיוות צורה בין ממוצע למטרה."""
    # רשת בסיס
    grid_x, grid_y = np.meshgrid(
        np.linspace(-0.5, 0.5, 10),
        np.linspace(-0.5, 0.5, 10)
    )
    grid = np.stack([grid_x.ravel(), grid_y.ravel()], axis=1)

    # עיוות TPS
    warped = tps_warp(mean_shape, target_shape, grid)
    warped = warped.reshape(10, 10, 2)

    for row in warped:
        ax.plot(row[:, 0], row[:, 1], 'b-', lw=0.5, alpha=0.5)
    for col in warped.T.reshape(10, 10, 2):
        ax.plot(col[:, 0], col[:, 1], 'b-', lw=0.5, alpha=0.5)
    ax.set_title(title)
לשיעור הבא
מטלה 3 — ניתוח מטבעות — מועד הגשה: שבוע 8
- הריצו את כל צינור העיבוד (TPS → GPA → PCA)
- הסבירו: האם שני הקיסרים נפרדים בצורת המטבע?
- קראו: מודול 6
צורה בזמן — שי גורדין, אוניברסיטת אריאל